Test scores plotted against hours of study
library(tidyverse)
score <-c(43, 61, 85, 100)
hrs_study <-c(1, 2, 3, 4)
score_data <- tibble(hrs_study, score)

ggplot(score_data, aes(x = hrs_study, y = score)) + geom_point() + geom_smooth(method = "lm")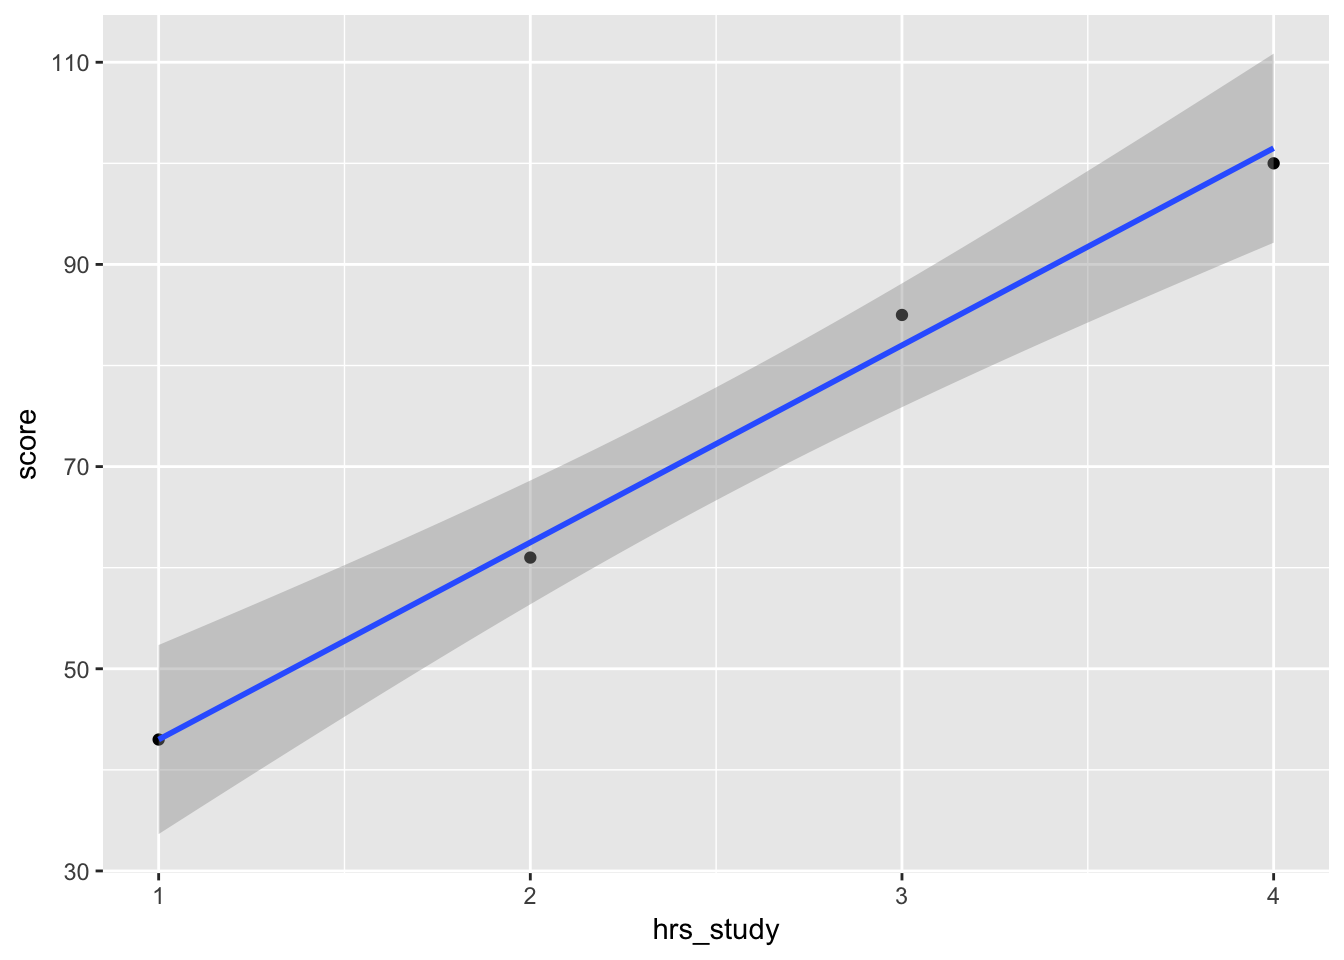
Now how about if we plot intrest on a scale of 1-10 and results on assignments?
library(tidyverse)
interest <-c(2, 4, 6, 8, 10)
results <- c(20, 40, 60, 80, 100)
results_interest <- tibble(interest, results)

ggplot(results_interest, aes(x = interest, y = results)) + geom_point() + geom_smooth(method = "lm")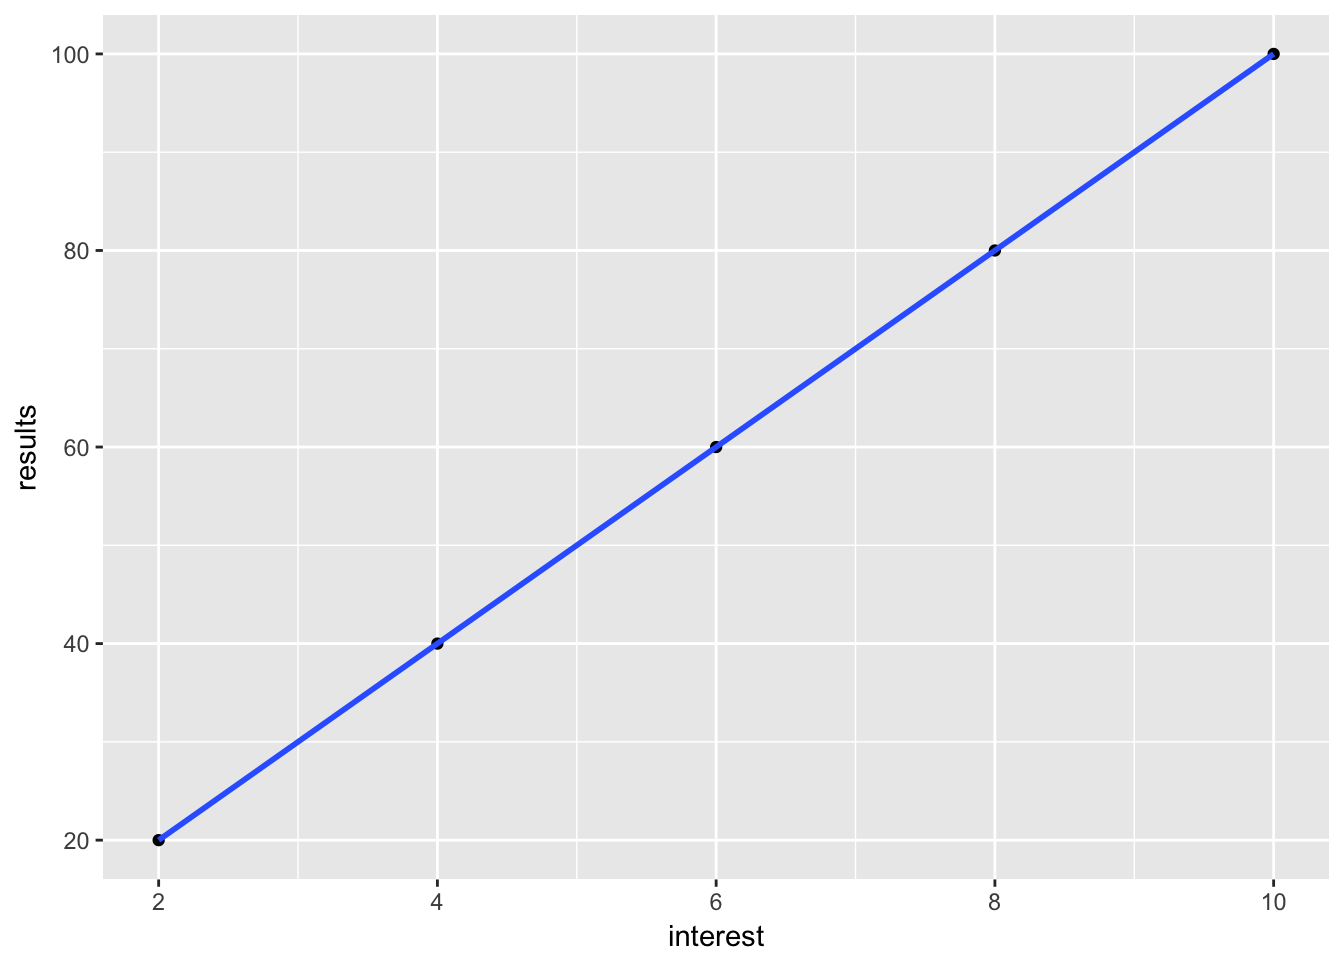
So it appears that the more interest you have in a subject, the better you tend to perform in it. But studying hard, even for your least favorite subject will also give you good scores.