library(tidyverse)
movie_title <- c("Get Out", "Casablanca", "Lady Bird", "Mad Max", "The Godfather", "Moonlight")
release_year <- c(2017, 1942, 2017, 2015, 1972, 2016)
box_office_mill <- c(254, 1, 70, 370, 245, 55)
moviedata <- tibble(release_year, box_office_mill)
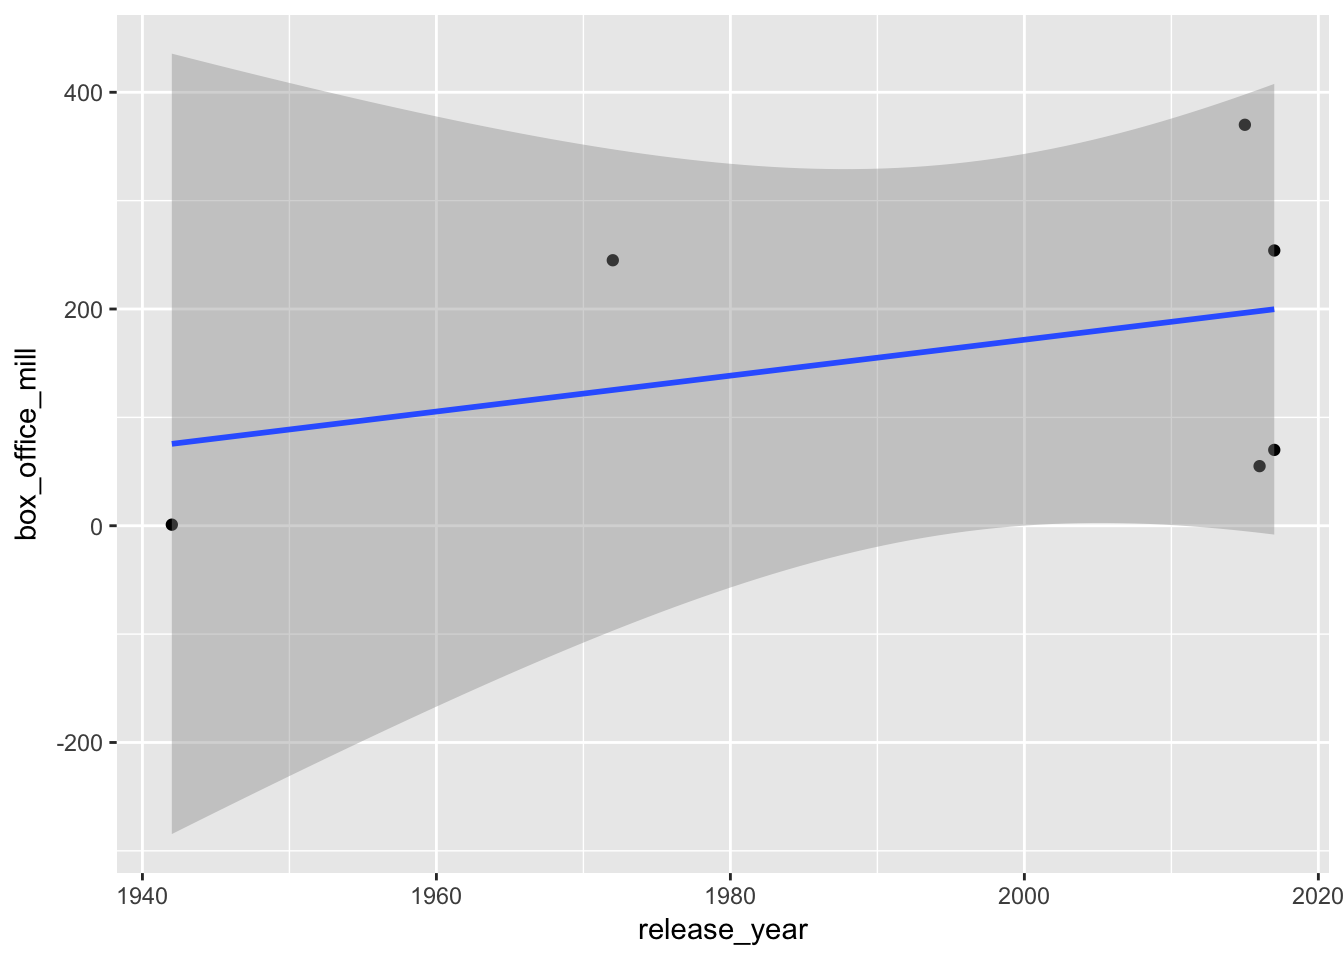
ggplot(moviedata, aes(x = release_year, y = box_office_mill)) + geom_point() + geom_smooth(method = "lm")