So over the summer, I took some Algebra/Advanced Algebra classes at Saturday Academy at PSU. We covered Exponents, Logarithms, matrices, polynomials, quadratics, solving systems of equations w/different methods, Factorisation, Graphing of functions,compound interest……
My favorite: Matrices, and graphs, so I’ll start out with writing functions and plotting them in R.
Linear equation in slope intercept form:
library(tidyverse)## Loading tidyverse: ggplot2
## Loading tidyverse: tibble
## Loading tidyverse: tidyr
## Loading tidyverse: readr
## Loading tidyverse: purrr
## Loading tidyverse: dplyr## Conflicts with tidy packages ----------------------------------------------## filter(): dplyr, stats
## lag(): dplyr, statsfunc_parabola <- function(x) {
x^2
}
func_parabola = function(x){
x^2
}
plot(func_parabola, 2,-2)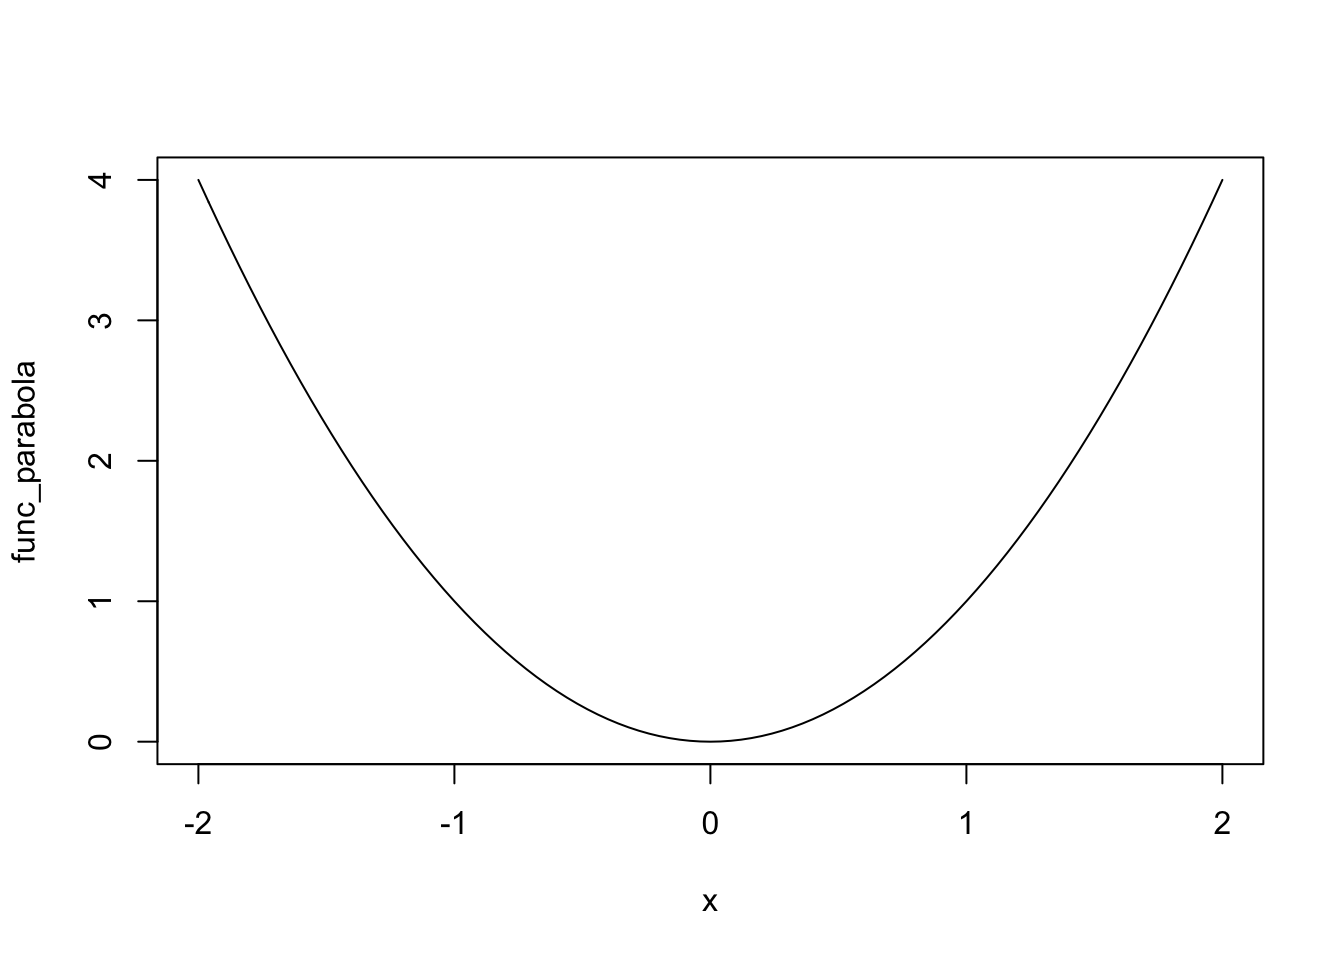
domain_data <- tibble(x = c(2,-2))

plot(func_parabola(c(2,-2)))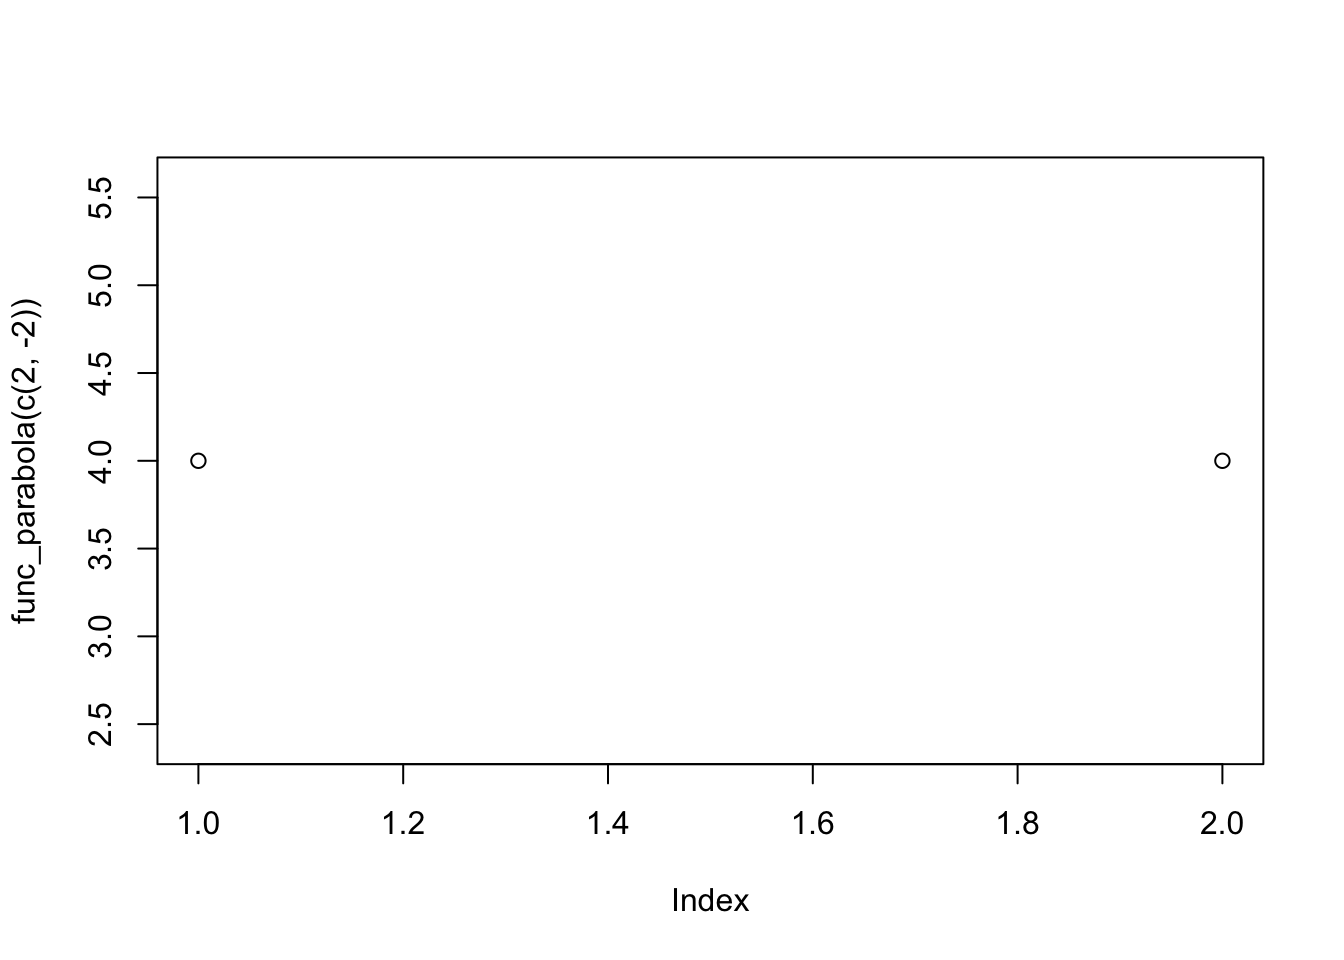
domain_data %>% ggplot(aes(x = x)) + stat_function(fun = func_parabola)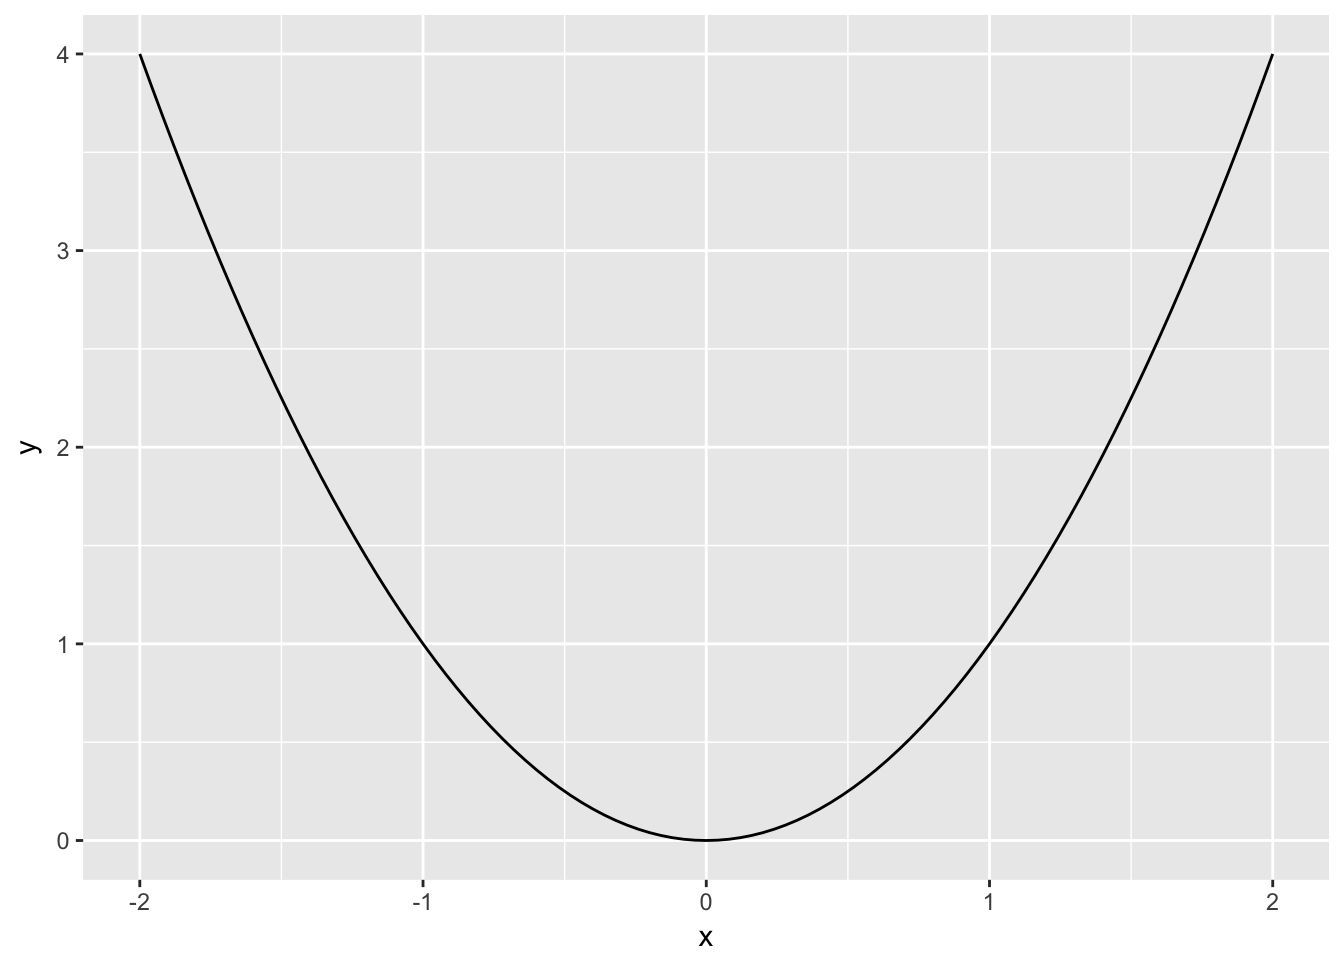
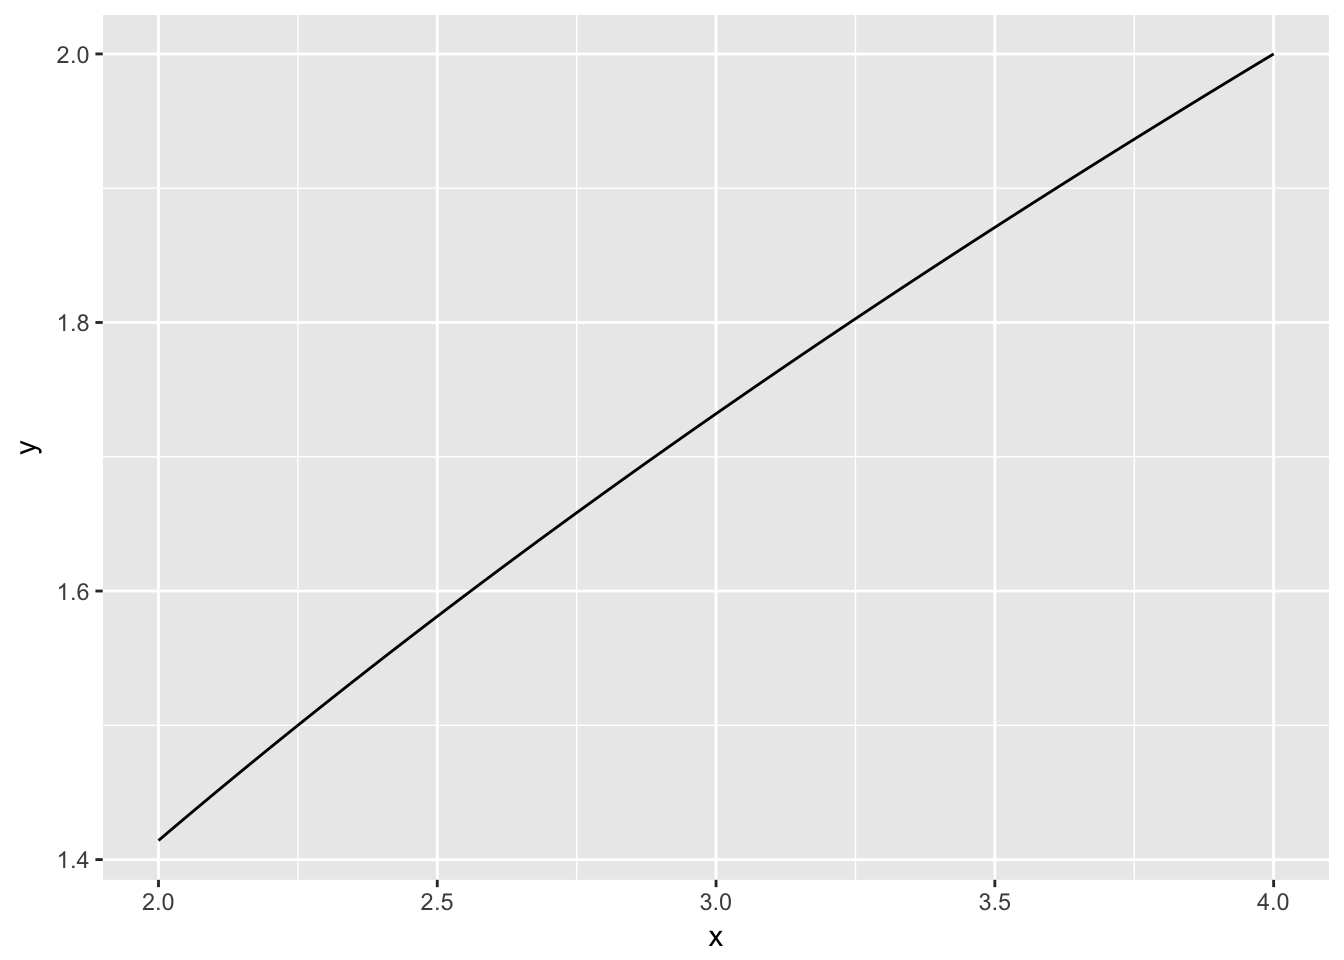
domain_data_1 <- tibble(x = c(2,4))
sqroot_function <- function(x){
  if(x>=0) {
    sqrt(x)
  }
}

domain_data_1 %>% ggplot(aes(x =x)) + stat_function(fun = sqroot_function)
## Warning in if (x >= 0) {: the condition has length > 1 and only the first
## element will be used