Science Assignment
Purpose
To investigate the difference between an exothermic and endothermic reaction
Data Tables:
- Time in seconds as independent variable
- Temperature as dependent variable
Creating datatables in R.
#Vinegar and Baking soda

library(tidyverse)

#Create vectors for the data from my experiments.

Time_seconds = c(0, 10, 20, 30, 40, 50, 60, 70, 80, 90, 100, 110)
Temp_VinegarBakingSoda_5g = c(17, 13, 12, 12, 11, 11, 11, NA, NA, NA, NA, NA)
Temp_VinegarBakingSoda_10g = c(15, 12, 10, 9, 9, 9, NA, NA, NA, NA, NA, NA)
Temp_VinegarBakingSoda_15g = c(15, 12, 10, 9, 8, 8, 8, NA, NA, NA, NA, NA)

Temp_HydrogenPeroxideYeast_3g = c(15, 17, 25, 28, 25, 28, 30, 32, 30, 32, 32, 32)
Temp_HydrogenPeroxideYeast_6g = c(13, 15, 24, 24, 28, 30, 31, 31, 31, NA, NA, NA)
Temp_HydrogenPeroxideYeast_9g = c(12, 15, 22, 23, 25, 28, 29, 30, 31, 30, 30, 30)

Data_obs_VB <- tibble(Time_seconds,
                      Temp_VinegarBakingSoda_5g,
                      Temp_VinegarBakingSoda_10g,
                      Temp_VinegarBakingSoda_15g)

Data_obs_HY <- tibble(Time_seconds,
                      Temp_HydrogenPeroxideYeast_3g,
                      Temp_HydrogenPeroxideYeast_6g,
                      Temp_HydrogenPeroxideYeast_9g)

Data_obs <- tibble(Time_seconds,
                   Temp_VinegarBakingSoda_5g,
                   Temp_VinegarBakingSoda_10g,
                   Temp_VinegarBakingSoda_15g,
                   Temp_HydrogenPeroxideYeast_3g,
                   Temp_HydrogenPeroxideYeast_6g,
                   Temp_HydrogenPeroxideYeast_9g)

Data_obs
## # A tibble: 12 x 7
## Time_seconds Temp_VinegarBak… Temp_VinegarBak… Temp_VinegarBak…
## <dbl> <dbl> <dbl> <dbl>
## 1 0 17 15 15
## 2 10 13 12 12
## 3 20 12 10 10
## 4 30 12 9 9
## 5 40 11 9 8
## 6 50 11 9 8
## 7 60 11 NA 8
## 8 70 NA NA NA
## 9 80 NA NA NA
## 10 90 NA NA NA
## 11 100 NA NA NA
## 12 110 NA NA NA
## # … with 3 more variables: Temp_HydrogenPeroxideYeast_3g <dbl>,
## # Temp_HydrogenPeroxideYeast_6g <dbl>,
## # Temp_HydrogenPeroxideYeast_9g <dbl>#Create a long format for the table for the plot.
long_Data_obs_VB <- gather(Data_obs_VB, key = "Trial_No", value = "Temperature", Temp_VinegarBakingSoda_5g:Temp_VinegarBakingSoda_15g)
long_Data_obs_HY <- gather(Data_obs_HY, key = "Trial_No", value = "Temperature", Temp_HydrogenPeroxideYeast_3g:Temp_HydrogenPeroxideYeast_9g)
long_Data_obs <- gather(Data_obs, key = "Trial_No", value = "Temperature", Temp_VinegarBakingSoda_5g:Temp_HydrogenPeroxideYeast_9g)
ggplot(long_Data_obs, aes(x = as.factor(Time_seconds), y = Temperature, col = Trial_No)) + geom_point(na.rm = T) 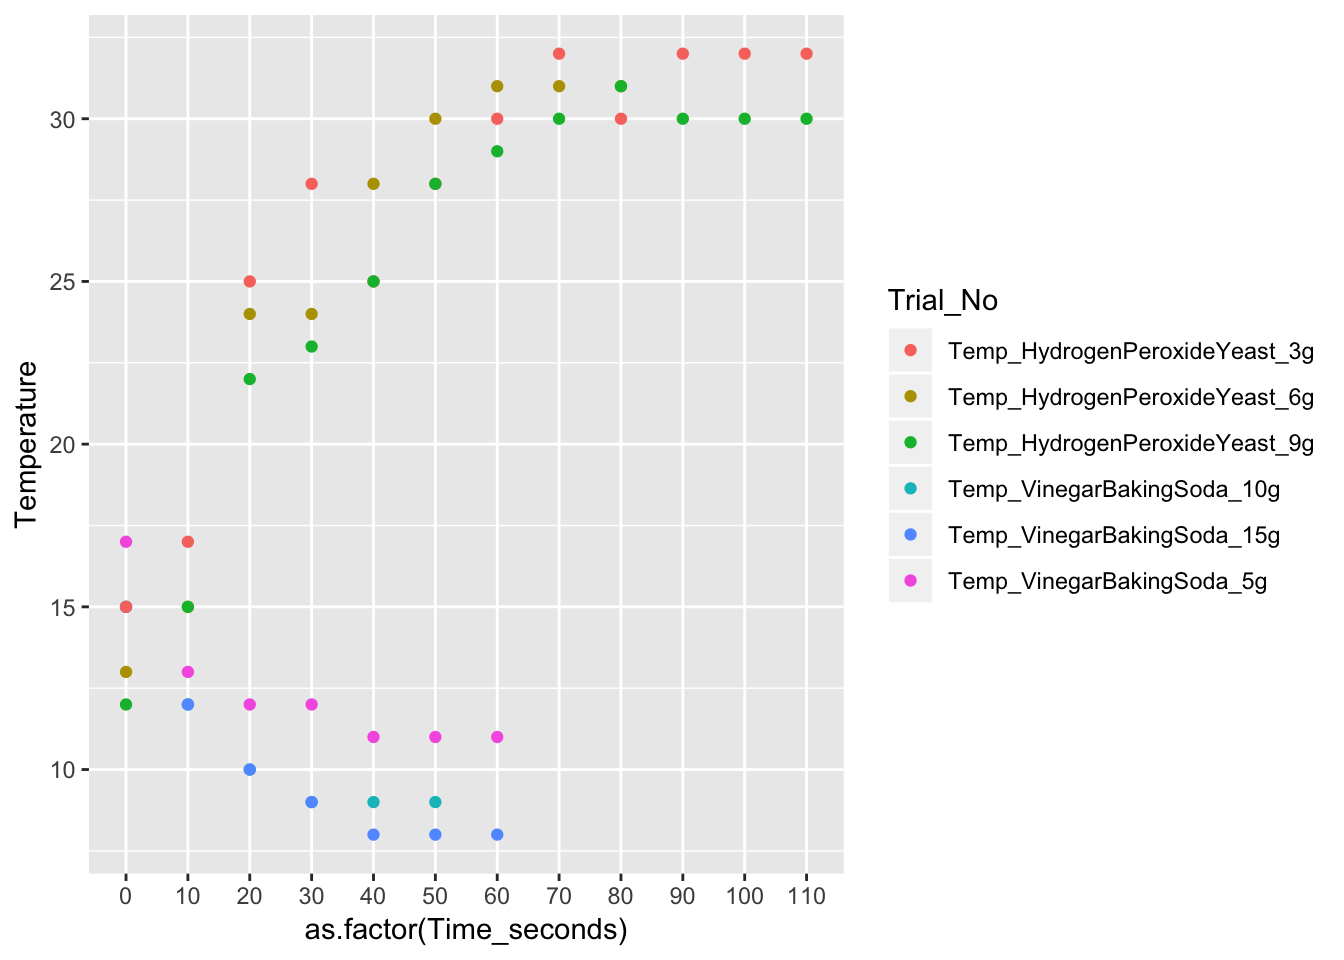
1. Did changing the concentration of the solid affect the change in temperature of the reaction? Why do you believe this is so?
Yes, changing the concentration affected the temperature. In the vinegar+Baking soda experiment, the temperature reached its equilibrium at \(11^0\)C with 5 grams. The second trial reached its equilibrium at \(9^0\)C with 10 grams and the third trial reached its equilibrium at \(8^0\)C with 15 g.
In the Hydrogen + yeast experiment, the temperature reached its equilibrium at \(32^0\)C with 3 grams. The second trial reached equilibrium at \(30^0\)C with 6g. The third reached the equilibrium at \(30^0\)C with 9 grams. The higher the concentration of the solid, the lower the temperature. It is inversely related.
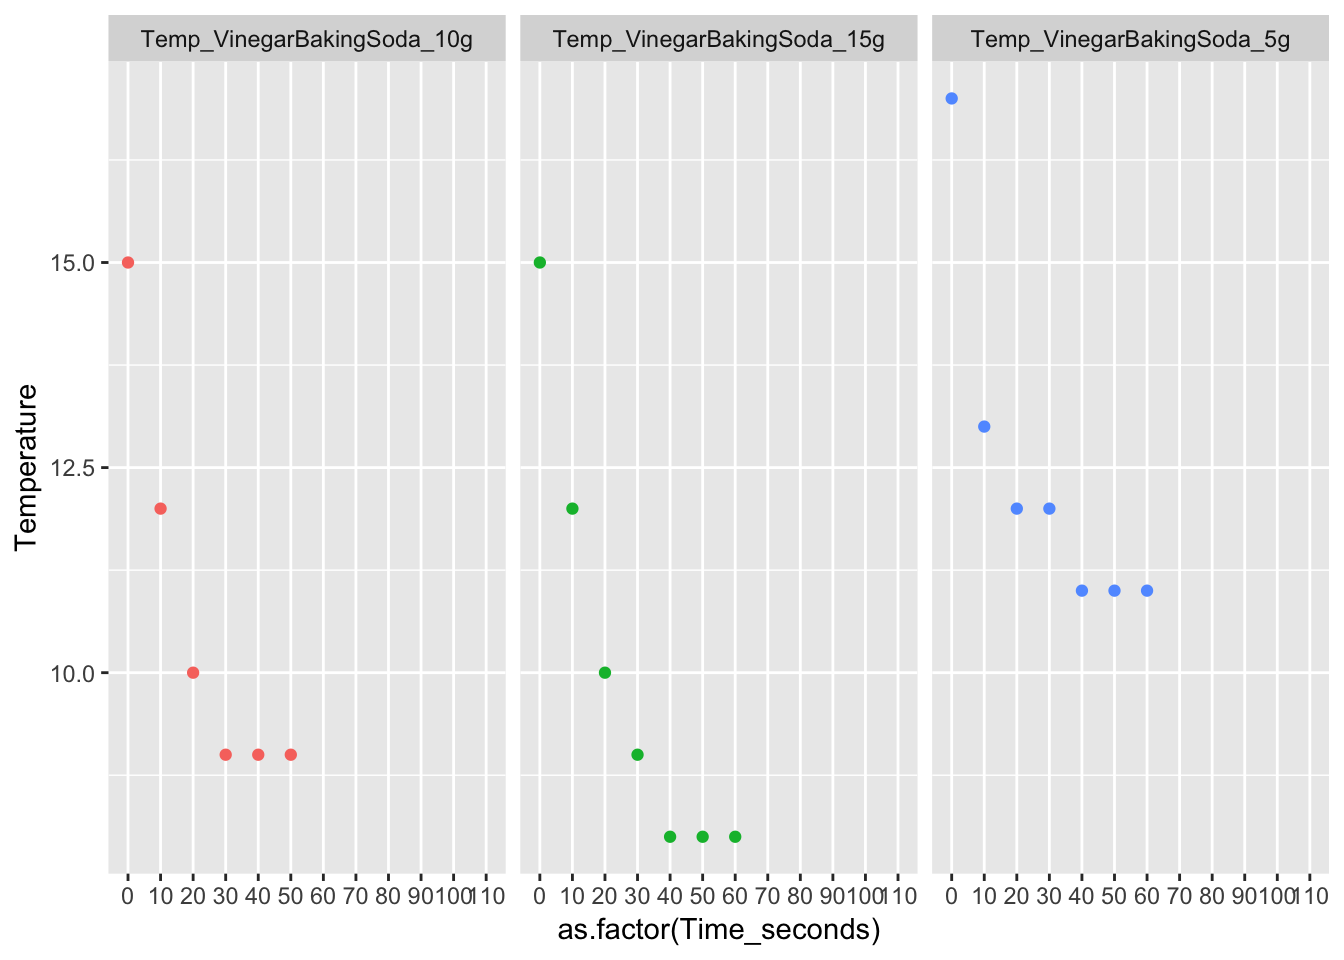
long_Data_obs %>% ggplot(aes( x = as.factor(Time_seconds), y = Temperature, col = Trial_No)) + geom_point(na.rm = T, show.legend = FALSE) + facet_wrap(.~Trial_No)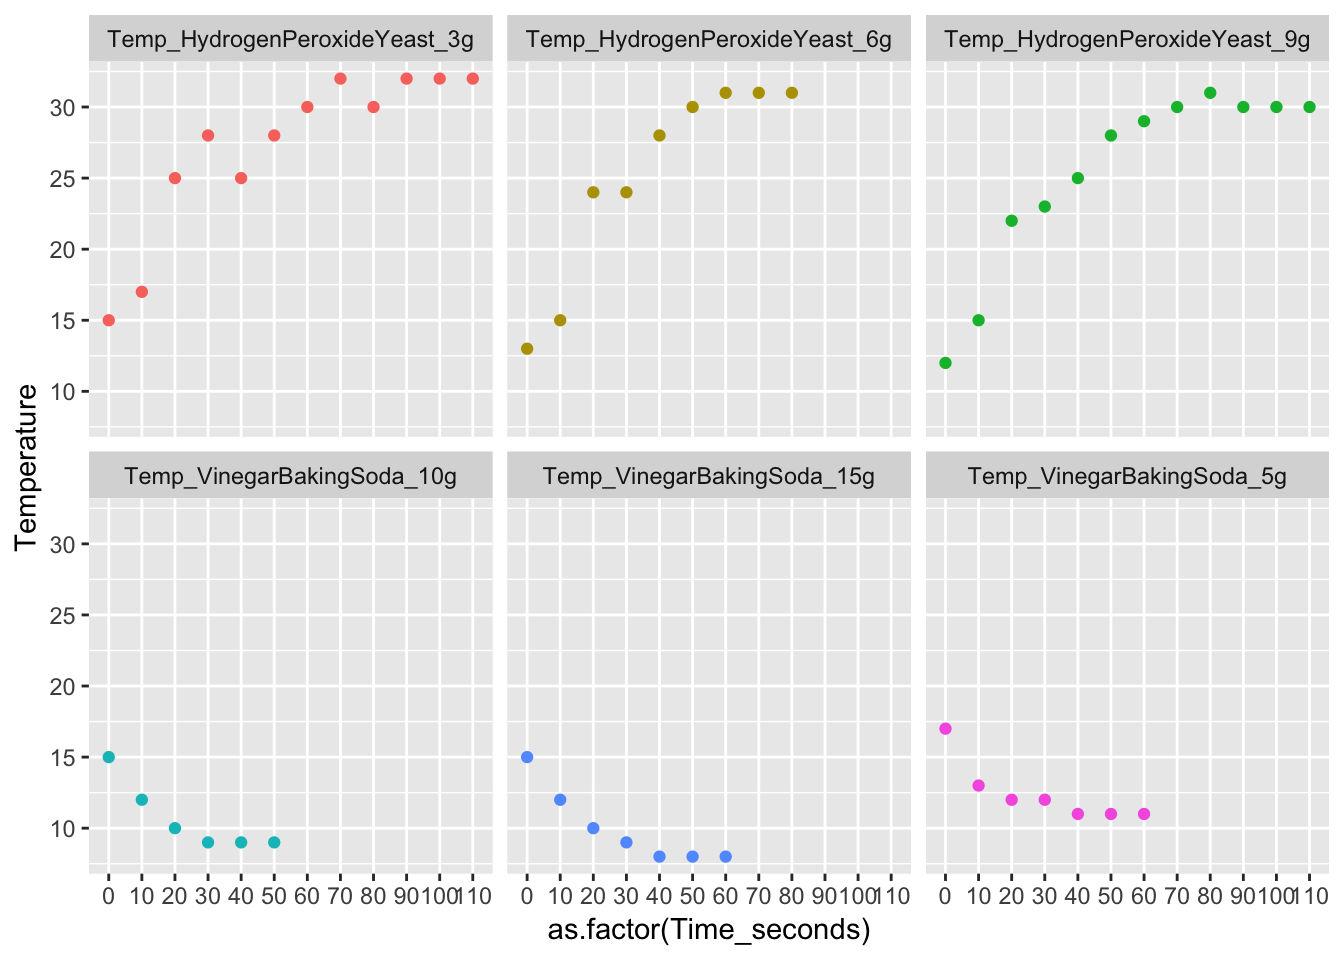
2. Does graphing your data result in a straight line? Explain why the graph looks the way it does.
No, graphing the data does not result in a straight line. With the Vinegar Baking soda data there is a negative correlation since it is exothermic. With the Hydrogen Peroxide + Yeast, there is a positive correlation. Both data sets have a curved live. This is because the temperature is increasing/decreasing at inconsistent rates. If the temperature increased/decreased at the same frequency, the lines would be straight.
Please see plot above
Compose 2 Claim-Evidence- Reasoning paragraphs to explain exothermic and endothermic reactions.
3. Claim: Which of the reactions was endothermic? Evidence: How do you know? Use data and be specific
Yeast + Hydrogen peroxide is an endothermic reaction. Endothermic means the chemicals final energy is greater than the starting/initial energy. The first trial starts at \(15^0\)C and ends at \(32^0\)C. The second trial starts at \(13^0\)C and ends at \(31^0\)C. The third trial starts at \(12^0\)C and ends at \(30^0\)C. When plotted, the data points show a positive correlation. The starting temperature in all 3 trials were less than the equilibrium. Therefore the yeast + hydrogen peroxide is an endothermic reaction.
long_Data_obs_HY %>% ggplot(aes( x = as.factor(Time_seconds), y = Temperature, col = Trial_No)) + geom_point(na.rm = T, show.legend = FALSE) + facet_wrap(.~Trial_No)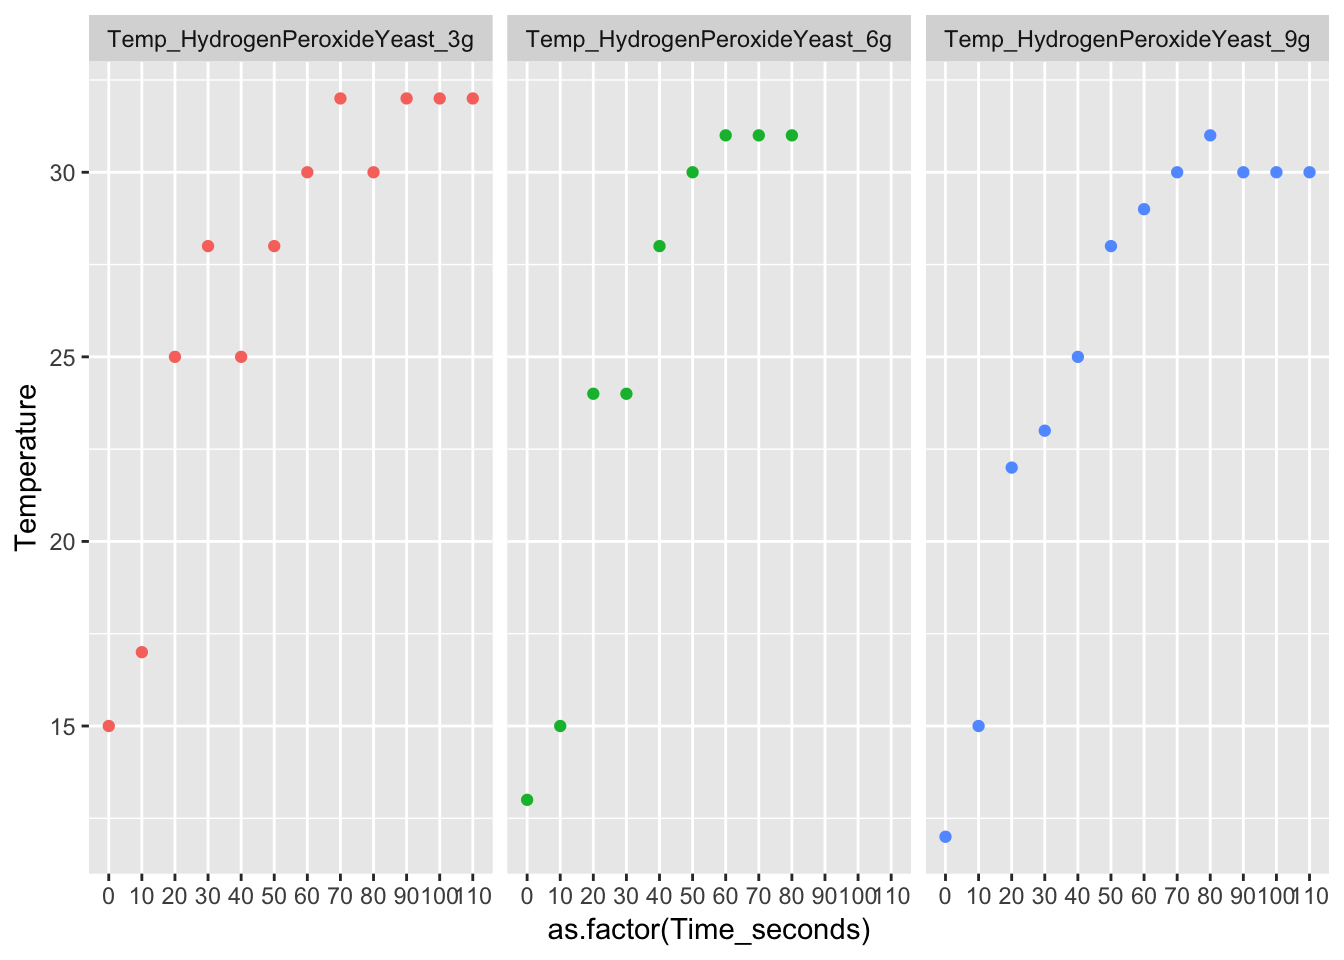
4. Claim: Which reaction was exothermic? Evidence: How do you know?
Vinegar + Baking Soda is an exothermic reaction. Exothermic means the final energy is less than the starting energy. The first trial that starts at 17 and ends at 11. The second trial starts at \(15^0\)C and ends at \(9^0\)C. The third trial starts at \(15^0\)C and ends at \(8^0\)C. When plotted, the correlation is negative. In all the trials, the starting temperature was greater than the equilibrium; Therefore, Vinegar + Baking soda is a exothermic reaction.
long_Data_obs_VB %>% ggplot(aes( x = as.factor(Time_seconds), y = Temperature, col = Trial_No)) + geom_point(na.rm = T, show.legend = FALSE) + facet_wrap(.~Trial_No)